
The Extreme Costs of Abortion Bans to Women and the US Economy
In the three years since Roe v. Wade was overturned, we continue to see significant harms to women—and staggering costs to the economy. The 16 states with the most restrictive abortion policies cost the US economy more than $64 billion annually.1
This figure, based on policies in place in 2024, only reflects the impact of the most severe abortion restrictions, like total bans or six-week gestational limits. When factoring in state-level policies that impose significant barriers, such as mandatory waiting periods and medically unnecessary restrictions on providers, combined with the lack of federal protections, the annual economic toll rises to over $133 billion.
This isn’t just a crisis for women. It’s a national economic crisis.
Abortion restrictions are not abstract policy decisions—they have real, measurable economic consequences. Abortion bans reduce women’s participation in the workforce, lower their earnings, and limit their career trajectories. Businesses in ban states struggle to attract and retain talent, residents leave these states, and local economies fall behind.
Full participation in the workforce depends on the ability to control one’s own reproductive life. Until we treat abortion access as an economic policy issue, as well as a health equity and human rights issue, the country will keep losing billions year after year.
Key Findings
The 16 states with the most restrictive abortion policies are responsible for over $64 billion in annual economic losses. When factoring in all state-level policies that restrict abortion access, combined with the lack of federal protections, this figure rises to over $133 billion nationally.
Without policy restrictions on abortion access:
- National GDP would rise by 0.5 percent, enough to offset the US economy’s 0.3 percent contraction in the first quarter of 2024.
- Labor force participation among women ages 15 to 44 would be significantly higher. Over 556,000 more women in this age group would be in the US workforce annually without abortion restriction
Policies that restrict access to abortion come at a steep cost to state economies. In a state-by-state ranking of economic impacts tied to abortion restrictions, the top 10 states with the greatest costs all have some of the most restrictive policies:
- Economic Losses: The 10 states experiencing the largest economic losses—each losing 0.8 percent or more of their annual state GDP—are: Alabama, Arkansas, Idaho, Indiana, Kentucky, Mississippi, Missouri, South Carolina, South Dakota, and West Virginia.
- Labor Force Impact: The 10 states with the largest labor force declines—each losing 2.0 percent or more of their labor force of women ages 15 to 44—are: Alabama, Arkansas, Florida, Kentucky, Louisiana, Mississippi, Oklahoma, Tennessee, Texas, and West Virginia.
The harm from abortion restrictions is widespread, but the impact is unequal. Women who already face racism and systemic barriers—especially Black and Latina women—are often hit hardest in terms of the impact of these restrictions on labor force participation and earnings. If abortion restrictions were lifted:
- The potential labor force gains would be 1.4 percent among Black and Latina women ages 15
to 44 compared to 1.1 percent for White women. - It would result in significant earnings growth for all working women ages 15 to 44 (8.5
percent), with the greatest gains for Black women (9.6 percent).
Below you will find an interactive map. Please navigate the map by hovering your mouse above the state you wish to learn more about.
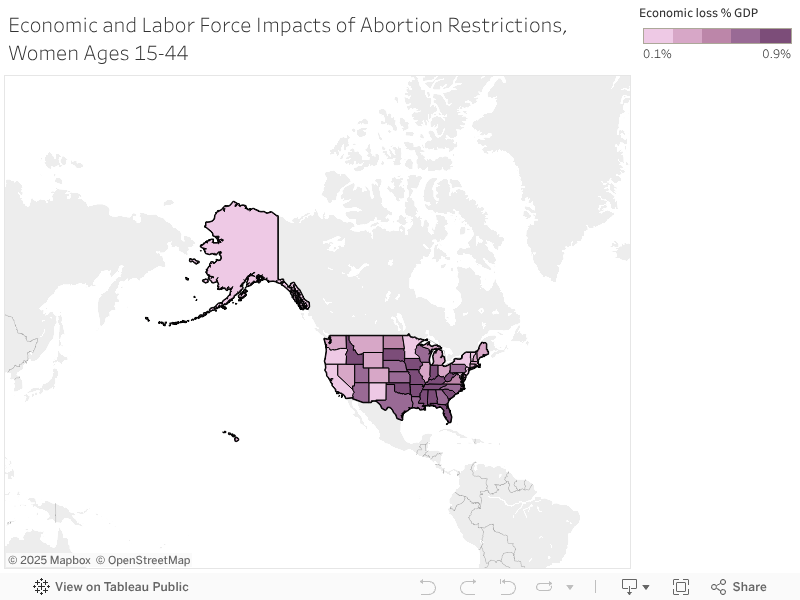
Economic and Labor Force Impacts of Abortion Restrictions, Women Ages 15–44
| State | Average annual economic loss % GDP | Average annual economic loss | Average annual % labor force loss | Average annual labor force loss |
|---|---|---|---|---|
| Alabama | 0.8% | $2,674,983,940 | 2.2% | 14,415 |
| Alaska | 0.2% | $164,966,774 | 0.9% | 870 |
| Arizona | 0.6% | $3,242,755,057 | 1.3% | 13,462 |
| Arkansas | 0.9% | $1,653,657,022 | 2.1% | 8,387 |
| California | 0.2% | $7,525,695,126 | 0.6% | 30,272 |
| Colorado | 0.3% | $1,837,638,441 | 0.7% | 6,294 |
| Connecticut | 0.3% | $1,037,104,849 | 0.7% | 3,514 |
| Delaware | 0.3% | $351,544,122 | 1.1% | 1,416 |
| District of Columbia | 0.2% | $360,742,927 | 0.6% | 861 |
| Florida | 0.8% | $13,169,064,616 | 2.0% | 54,885 |
| Georgia | 0.7% | $6,129,768,389 | 1.7% | 26,052 |
| Hawaii | 0.3% | $315,442,526 | 0.8% | 1,454 |
| Idaho | 0.8% | $1,075,090,915 | 1.9% | 5,141 |
| Illinois | 0.3% | $3,795,053,358 | 0.7% | 13,029 |
| Indiana | 0.8% | $4,259,104,512 | 1.8% | 17,012 |
| Iowa | 0.8% | $2,068,968,064 | 1.5% | 6,871 |
| Kansas | 0.6% | $1,317,066,041 | 1.1% | 4,585 |
| Kentucky | 0.8% | $2,391,096,251 | 2.1% | 12,455 |
| Louisiana | 0.7% | $2,387,365,812 | 2.2% | 12,615 |
| Maine | 0.4% | $356,557,962 | 0.6% | 1,201 |
| Maryland | 0.1% | $591,767,069 | 0.3% | 2,254 |
| Massachusetts | 0.3% | $2,422,633,416 | 0.7% | 7,001 |
| Michigan | 0.3% | $1,826,293,792 | 0.5% | 6,789 |
| Minnesota | 0.2% | $1,227,764,538 | 0.4% | 3,338 |
| Mississippi | 0.8% | $1,335,495,818 | 2.3% | 8,377 |
| Missouri | 0.9% | $4,078,485,128 | 1.5% | 13,184 |
| Montana | 0.4% | $288,924,894 | 0.7% | 1,133 |
| Nebraska | 0.6% | $1,174,914,888 | 1.2% | 3,630 |
| Nevada | 0.4% | $1,037,980,798 | 1.1% | 4,779 |
| New Hampshire | 0.4% | $542,433,147 | 0.9% | 1,718 |
| New Jersey | 0.2% | $1,865,340,856 | 0.5% | 6,306 |
| New Mexico | 0.2% | $269,416,232 | 0.6% | 1,589 |
| New York | 0.2% | $3,792,535,765 | 0.6% | 14,185 |
| North Carolina | 0.6% | $4,865,271,976 | 1.4% | 20,644 |
| North Dakota | 0.5% | $375,784,004 | 1.0% | 1,174 |
| Ohio | 0.4% | $4,012,869,841 | 1.0% | 16,232 |
| Oklahoma | 0.8% | $2,138,353,598 | 2.1% | 11,303 |
| Oregon | 0.1% | $419,907,726 | 0.2% | 1,512 |
| Pennsylvania | 0.6% | $6,367,290,303 | 1.3% | 22,676 |
| Rhode Island | 0.6% | $470,711,566 | 0.9% | 1,448 |
| South Carolina | 0.8% | $2,955,536,869 | 2.0% | 13,735 |
| South Dakota | 0.8% | $611,703,705 | 1.4% | 1,858 |
| Tennessee | 0.8% | $4,261,338,986 | 2.1% | 19,771 |
| Texas | 0.7% | $18,482,252,283 | 2.1% | 88,333 |
| Utah | 0.6% | $1,728,696,270 | 1.6% | 8,431 |
| Vermont | 0.1% | $66,296,074 | 0.2% | 198 |
| Virginia | 0.5% | $4,067,417,237 | 1.3% | 15,845 |
| Washington | 0.3% | $2,321,449,614 | 0.8% | 8,715 |
| West Virginia | 0.8% | $914,165,836 | 2.2% | 4,297 |
| Wisconsin | 0.6% | $2,814,474,833 | 1.1% | 9,769 |
| Wyoming | 0.3% | $178,530,686 | 1.3% | 1,027 |
| United States | 0.5% | $133,619,704,453 | 1.2% | 556,042 |
Economic Impact of Abortion Restrictions on Labor Force Participation and Earnings Growth Among Women Ages 15–44, by Race and Ethnicity
| Race/ethnicity | Average annual % labor force loss | Average annual % earnings growth loss |
|---|---|---|
| White | 1.1% | 8.7% |
| Black | 1.4% | 9.6% |
| Latina | 1.4% | 8.3% |
| Asian & Pacific Islander | 1.0% | 6.6% |
| Other | 1.3% | 8.4% |
| All | 1.2% | 8.5% |
Methodology
The results presented in this analysis reflect the most recent estimates from IWPR’s “Cost of Reproductive Health Restrictions” model. As in our prior years’ analyses, this study seeks to answer the question: What are the economic costs of abortion restrictions at the state level?
This model relies on population-level macroeconomic analysis, drawing on three years of data (2022– 2024) from the US Bureau of Labor Statistics’ monthly Current Population Survey (CPS). All dollar amounts are inflation-adjusted and reported in constant 2024 dollars.
Our key independent variable is the severity of state-level abortion policies ranging from “most protective” to “most restrictive,” based on the Guttmacher Institute’s seven-tier classification system presented in “State Policy Trends 2024: Anti-Abortion Policymakers Redouble Attacks on Bodily Autonomy” (as of December 2024). Each of the 50 states and the District of Columbia was assigned a value from 1 to 7, with 1 representing “most protective” and 7 representing “most restrictive.” As of December 2024, 16 states fell into the “most restrictive” category, while three were classified as “most protective.”
Due to changes in data availability, this year’s model uses Guttmacher Institute’s classification system in place of the individual-level abortion policy indicators employed in previous years. Despite this shift in approach, our findings remain robust and consistent with earlier results.
Following the methodology used previously, we estimate the effects of state-level abortion restrictions on labor force participation among women ages 15 to 44, and we assess the impact of these policies on the earnings of employed women in this same age group working in the private sector.
This content on this website was updated on June 11, 2025.
1 These are the 16 states categorized as “most restrictive” by the Guttmacher Institute in “State Policy Trends 2024:Anti-Abortion Policymakers Redouble Attacks on Bodily Autonomy” as of December 2024. See https://www.guttmacher.org/2024/12/state-policy-trends-2024-anti-abortion-policymakers-redouble-attacksbodily-autonomy