
2022 Analysis: Costs of Reproductive Health Restrictions
Access to comprehensive reproductive health care is central to women’s freedom and full participation in society. In recent decades, a rise in state efforts to limit access to reproductive health care has threatened women’s equality and put state and regional economies at risk. Between January 1st and April 29, 2021, 108 state-level abortion restrictions were enacted, the most in more than 10 years. In 2022, there were fewer abortion restrictions passed – 50 – but many were near-total or total bans, meaning women in those states can no longer access abortion there. These restrictions fall hardest on women who already face systemic obstacles accessing health care and economic opportunities: Black, Hispanic, low-income, young, and rural women, as well as LGBTQ+ individuals.
While the cost of reproductive health restrictions is most harmful to women and their families, it also has consequences for businesses and state economies. Restrictions reduce women’s participation in the workforce, which results in significant loss of wages. For businesses, restrictions on access to reproductive health care affect their ability to achieve optimal results, which then impacts state economies.
This analysis provides an estimate of the cost of reproductive health restrictions at the state level.
Please note that this analysis does not include the impact of bans that would have been observed since the Dobbs Supreme Court decision. The analysis requires a full year of labor and census data, which is not yet available for 2023 when most of the impact would have occurred. Compared to our previous analysis, our current model accounts for the economic impact of new restrictions on medication abortion, a category we had not previously modeled. In December 2022, a total of 27 states had additional restrictions on medication abortion which had further impact on the cost to state economies and women’s labor force participation.

Ending Reproductive Health Restrictions: Good for Women, Good for Business
IWPR estimates restrictions placed on abortion access cost state economies nationally an annual average of $173 billion1 by reducing labor force participation, earnings levels, and increasing turnover and time off from work among women ages 15 to 44 years employed in the private sector.
Nationally, in 2022, an estimated 1.4% of women aged 15 to 44 would have entered the labor force in the absence of reproductive health restrictions.
If reproductive health restrictions were eliminated:
- Nearly 597,000 more women would be in the nation’s labor force annually.
- National GDP would be nearly 0.7 percent greater, ranging from 0.08 percent in the District of Columbia to over 1.3 percent in Missouri.
- Employed women aged 15 to 44 would earn an additional $4.3 billion
1 This value is adjusted for inflation and expressed in 2022 constant dollars
- By the end of 2022, 10 states enacted total bans on abortion, 14 enacted partial bans, and 26 enacted protections on abortion rights.
- In 2022, the 10 states with the most economic loss all have among the most restrictive abortion laws in the country: Utah, Idaho, Kentucky, Oklahoma, Nebraska, Mississippi, Arkansas, Indiana, Michigan*, and Missouri.
- Most of these states have total abortion bans. In Nebraska, abortion is banned after 12 weeks and in Utah, it is banned after 18 weeks.
- Since our last analysis, these states all experienced an increase in GDP loss due to abortion restrictions. The 10 states averaged an increase of 0.3% loss from 2020.
- *Michigan is an outlier among these 10 states. Abortion is legal “until viability”. Eighteen states have the same legal limit and none of them saw an economic loss as high as Michigan’s.
- In 2022, the 10 states (including DC) with the least economic loss all have protections in place for abortion access: the District of Columbia, Vermont, Colorado, New York, Oregon, California, Washington, Hawaii, New Jersey, and New Hampshire.
- Half of these states have no limit on abortion, and the other half allow abortion until viability.
- All these states are losing more money now than in 2020. However, the increased loss is significantly lower than the bottom states. On average, the state GDP loss increased by 0.10 percentage points, nearly a third of what the bottom states experienced.
- Noteworthy: Illinois had the eighth-lowest economic loss in 2020. In 2022, it is ranked 19 (jumping from 0.22% in lost GDP to 0.52%).
2 Note: When states are listed out, they are in order from states with the lowest economic loss to states with the greatest economic loss. In other words, they are always ranked from best to worst.
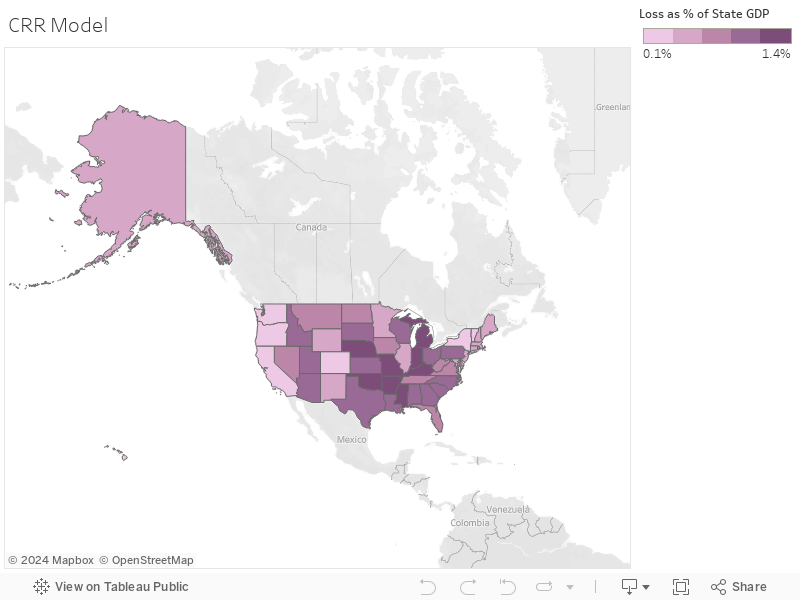
Below you will find an interactive map. Please navigate the map by hovering your mouse above the state you wish to learn more about.
Key Findings
| State | Average Annual Economic Loss as a % of State GDP* | Total Average Annual Economic Loss | Average Annual % Labor Force Loss Women 15-44 | Total Average Annual Labor Force Loss Women 15-44 |
|---|---|---|---|---|
| Alabama | 0.90% | $2,381,904,951 | 1.60% | 9,608 |
| Alaska | 0.40% | $251,941,285 | 1.30% | 1,197 |
| Arizona | 1.00% | $4,519,289,297 | 1.70% | 16,480 |
| Arkansas | 1.20% | $1,934,189,137 | 2.00% | 7,786 |
| California | 0.30% | $10,934,214,122 | 0.80% | 39,188 |
| Colorado | 0.20% | $1,202,817,459 | 0.40% | 3,632 |
| Connecticut | 0.40% | $1,403,507,109 | 0.80% | 4,065 |
| Delaware | 0.40% | $352,847,713 | 0.90% | 1,252 |
| District Of Columbia | 0.10% | $124,781,412 | 0.20% | 226 |
| Florida | 0.80% | $11,143,499,582 | 1.50% | 38,850 |
| Georgia | 1.00% | $7,756,934,100 | 2.00% | 29,545 |
| Hawaii | 0.30% | $311,431,790 | 0.70% | 1,208 |
| Idaho | 1.10% | $1,208,139,811 | 1.80% | 4,715 |
| Illinois | 0.50% | $5,404,904,981 | 0.80% | 13,936 |
| Indiana | 1.30% | $5,751,383,019 | 1.90% | 17,570 |
| Iowa | 0.80% | $1,782,683,983 | 1.10% | 5,230 |
| Kansas | 1.00% | $2,117,037,448 | 1.60% | 6,525 |
| Kentucky | 1.10% | $2,883,170,259 | 2.00% | 11,372 |
| Louisiana | 1.00% | $2,892,193,024 | 2.10% | 12,379 |
| Maine | 0.40% | $349,139,550 | 0.60% | 1,064 |
| Maryland | 0.50% | $2,363,182,649 | 0.90% | 7,608 |
| Massachusetts | 0.50% | $3,351,868,058 | 0.80% | 8,242 |
| Michigan | 1.30% | $8,134,505,377 | 1.90% | 24,722 |
| Minnesota | 0.50% | $2,423,433,112 | 0.70% | 6,114 |
| Mississippi | 1.20% | $1,624,032,006 | 2.20% | 7,793 |
| Missouri | 1.40% | $5,301,556,113 | 1.90% | 15,401 |
| Montana | 0.70% | $485,735,167 | 0.90% | 1,512 |
| Nebraska | 1.10% | $1,807,076,570 | 1.60% | 4,785 |
| Nevada | 0.60% | $1,278,811,331 | 1.30% | 5,173 |
| New Hampshire | 0.40% | $402,422,743 | 0.60% | 1,164 |
| New Jersey | 0.40% | $2,632,003,726 | 0.60% | 7,596 |
| New Mexico | 0.50% | $564,057,452 | 1.10% | 2,648 |
| New York | 0.30% | $5,647,547,105 | 0.70% | 17,527 |
| North Carolina | 1.00% | $7,301,199,945 | 2.00% | 27,778 |
| North Dakota | 0.80% | $592,839,882 | 1.50% | 1,672 |
| Ohio | 0.90% | $7,147,435,525 | 1.50% | 23,109 |
| Oklahoma | 1.10% | $2,667,007,621 | 2.30% | 11,981 |
| Oregon | 0.30% | $826,785,819 | 0.40% | 2,620 |
| Pennsylvania | 0.90% | $8,548,925,192 | 1.50% | 25,766 |
| Rhode Island | 0.80% | $572,506,535 | 0.90% | 1,516 |
| South Carolina | 1.00% | $2,995,847,675 | 1.80% | 11,505 |
| South Dakota | 1.00% | $671,354,489 | 1.50% | 1,897 |
| Tennessee | 0.80% | $3,809,082,532 | 1.40% | 13,463 |
| Texas | 1.00% | $23,002,230,902 | 2.30% | 93,244 |
| Utah | 1.10% | $2,631,931,918 | 2.10% | 10,636 |
| Vermont | 0.20% | $62,854,531 | 0.20% | 179 |
| Virginia | 0.60% | $4,086,077,720 | 1.10% | 13,386 |
| Washington | 0.30% | $2,293,473,626 | 0.70% | 7,295 |
| West Virginia | 0.80% | $755,375,307 | 1.50% | 3,115 |
| Wisconsin | 1.00% | $4,029,758,559 | 1.30% | 10,884 |
| Wyoming | 0.40% | $187,282,122 | 1.20% | 909 |
| National | 0.70% | $172,904,211,339 | 1.40% | 597,068 |
Notes: IWPR estimates using 2020-2022 Current Populations Survey Data. The number of restrictions by state are based on Guttmacher Institute’s “Overview of Abortion Laws” (May 2023). All values are reported in 2022 constant prices. *Annual Average Loss between 2020-2022 as a percentage of 2022 GDP.
Methodology
Results reported in this analysis correspond to a new estimation of IWPR’s Cost of Reproductive Health Restrictions model released in 2021. As in our previous analysis, this research seeks to answer the following question: What are the costs of abortion restrictions at the state level? This model uses population-level macro analyses, pooling three years of data from January 2020 to December 2022 of US Bureau of Labor Statistics (BLS) data from the monthly Current Population Survey (CPS). All values reported are adjusted for inflation using 2022 constant prices.
The number of state-level abortion restrictions, our key independent variable, is constructed based on the Guttmacher Institute’s “Overview of Abortion Laws” (May 2023).[1] For this ordinal measure, the abortion restrictions tracked by the Guttmacher Institute were weighed equally and combined into the following IWPR broader categories:
| IWPR Broad Categories | Guttmacher narrow categories |
|---|---|
| 1. TRAP Laws | a. Must be performed by a licensed physician b. Must be performed in a hospital if at (gestational age) c. Second physician must participate if at (gestational age) |
| 2. Bans of Procedures | a. Prohibited except in cases of life or health endangerment if at (gestational age) b. “Partial Birth” abortion banned |
| 3. Public Funding Restricted | a. Prohibits funding all or most medically necessary abortions b. Funds limited to life endangerment, rape, and incest |
| 4. Provider Can Refuse to Participate | a. Any limitations to private funding b. Private Insurance Coverage Limited |
| 5. Provider Can Refuse to Participate | a. Individual b. Institution |
| 6. Mandated Counseling Includes Information on: | a. Breast cancer link b. Fetal pain c. Negative psychological effects |
| 7. Waiting Period (18 or more hours after counseling) | |
| 8. Parental Consent Required for Minors | |
| 9. Medication restriction | a. Must be provided by physician b. Patient must have in person visit for prescription c. Gestational age limit for provision d. Patient must take first dose in the presence of physician e. Mailing of abortion pills banned |
1 Guttmacher Institute, “Overview of Abortion Laws.” https://www.guttmacher.org/state-policy/explore/overviewabortion-laws. IWPR analysis is based on the version available as of May 2023.
All states, including the District of Columbia (DC), were then assigned into abortion restrictions categories ranging from one to nine based on the number of abortion restrictions enacted in that state. All abortion restrictions were weighed equally in estimating the economic impacts on women’s labor force participation and earnings.
We follow our previous methodology to estimate the impact of state-level restrictions on women’s labor force participation between the ages of 15 and 44 and to evaluate the impact of state abortion restrictions on women’s earnings in this same age group and who were employed in the private sector. For an in-depth description of this methodology, please see The Costs of Reproductive Health Restrictions: An Economic Case for Ending Harmful State Policies.