
States That Ban Abortion Cost the US Economy $61 Billion Annually
Sixty-one billion. That's how much the 17 states that ban abortion are costing the US each year.
Abortion bans reduce women's participation in the workforce, which results in a significant loss of wages and economic power for women and their families. For businesses, restrictions on access to reproductive health care affect their ability to build a strong workforce and make their bottom line, which also impacts state economies.
We all know reproductive rights—including accessible abortion care—are essential to women's full participation in society. Less talked about is the impact these draconian laws have on the health of the national economy, where women are half of the workforce.
Since the Supreme Court overturned the federal right to an abortion in 2022, states have diverged in the legal right to and accessibility of reproductive health care.
A subset of states has passed bans and extreme restrictions, which harm all women of reproductive age and fall hardest on women who already face systemic obstacles accessing health care and economic opportunities: Black, Latina, low-income, young, and rural women, as well as LGBTQ+ individuals. IWPR's research shows these bans are also a tremendous drag on the US economy.
States that have enshrined the right to abortion and taken proactive steps toward protecting women's reproductive health are reducing these costs, but the economic consequences of abortion bans remain staggering.
IWPR's analysis measures the costs to state economies and businesses when they severely restrict access to reproductive health care and the degree to which the national costs of reproductive rights restrictions are offset by states that have strong protections for women seeking abortion care. The analysis includes data from 2023, after which the impact of Dobbs began to roll out across the states.
Ending Reproductive Health Restrictions: Good for Women, Good for Business
- IWPR estimates the 17 states that have either an abortion ban or extreme restrictions cost the national economy $61 billion alone.
- However, states that protect abortion are reducing these costs. If the 10 states that have strong protections for the right to abortion did not have these in place, the cost of reproductive rights restrictions to the national economy would be $78 billion more.
- In states with bans and extreme restrictions, labor force participation among women 15 to 44 would be higher absent these bans. For example, in Alabama, Kentucky, and Louisiana, women’s labor force participation would be 1.3 percent higher, and in Mississippi, it would be 1.4 percent higher.
- Nationally, an estimated additional 0.6 percent of women aged 15 to 44 would have entered the labor force in the absence of reproductive health restrictions. If those restrictions were eliminated:
- Nearly 286,000 more women would be in the nation’s labor force annually.
- National gross domestic product (GDP) would be nearly a half (0.4) percentage point higher, which would increase the most recent GDP growth rate estimate of 1.3 percent for June 2024 by over a third.
- Several states with bans—including Alabama, Arkansas, Idaho, Kentucky, Mississippi, Missouri, South Carolina, and West Virginia—would have GDPs that were over 0.8 percent higher, or about one-third of the most recent estimate of GDP growth.
- Employed women aged 15 to 44 would have earned an additional $6.4 billion in 2023. This website was updated on 1/28/2025.
Below you will find an interactive map. Please navigate the map by hovering your mouse above the state you wish to learn more about.
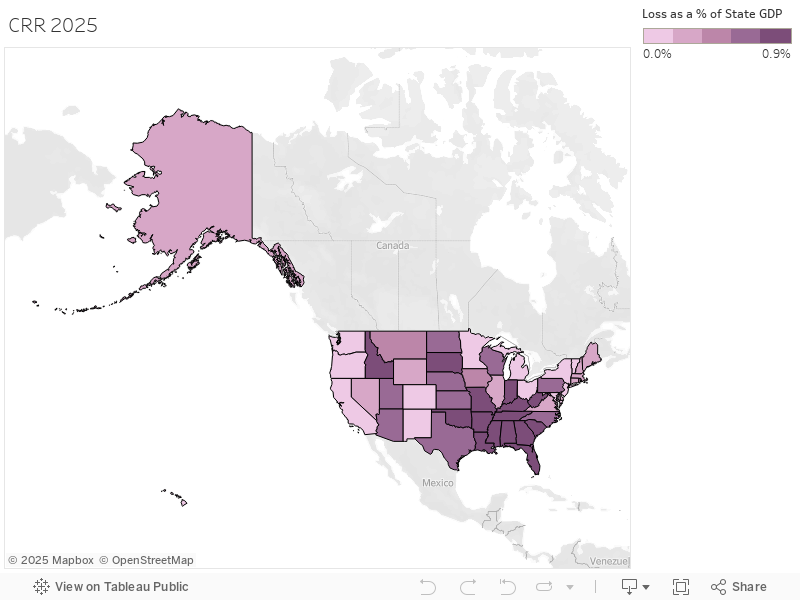
Key Findings
| State | Average Annual Economic Loss as a % of State GDP | Total Average Annual Economic Loss | Average Annual % Labor Force Loss Women Age 15-44 | Average Annual Labor Force Loss Women Age 15-44 |
|---|---|---|---|---|
| Alabama | 0.8% | 2,364,285,119 | 1.3% | 8,273 |
| Alaska | 0.2% | 155,175,880 | 0.6% | 573 |
| Arizona | 0.6% | 2,778,486,472 | 0.8% | 7,825 |
| Arkansas | 0.9% | 1,466,702,581 | 1.2% | 4,827 |
| California | 0.1% | 2,214,767,742 | 0.1% | 6,332 |
| Colorado | 0.1% | 742,705,190 | 0.2% | 1,814 |
| Connecticut | 0.3% | 839,768,005 | 0.4% | 1,931 |
| Delaware | 0.2% | 215,596,233 | 0.4% | 587 |
| District of Columbia | 0.0% | 72,181,999 | 0.1% | 123 |
| Florida | 0.7% | 11,329,196,937 | 1.2% | 31,747 |
| Georgia | 0.8% | 5,983,481,778 | 1.2% | 17,905 |
| Hawaii | 0.2% | 191,175,850 | 0.4% | 627 |
| Idaho | 0.8% | 932,192,629 | 1.0% | 2,808 |
| Illinois | 0.3% | 3,125,221,637 | 0.4% | 7,102 |
| Indiana | 0.8% | 3,765,815,910 | 1.1% | 10,034 |
| Iowa | 0.4% | 1,071,568,370 | 0.5% | 2,434 |
| Kansas | 0.6% | 1,228,020,745 | 0.7% | 3,025 |
| Kentucky | 0.8% | 2,164,308,289 | 1.3% | 7,127 |
| Louisiana | 0.7% | 2,185,540,991 | 1.3% | 7,521 |
| Maine | 0.2% | 211,603,210 | 0.3% | 492 |
| Maryland | 0.1% | 354,041,284 | 0.1% | 891 |
| Massachusetts | 0.3% | 2,002,125,474 | 0.4% | 3,788 |
| Michigan | 0.1% | 560,914,644 | 0.1% | 1,398 |
| Minnesota | 0.1% | 364,221,677 | 0.1% | 663 |
| Mississippi | 0.8% | 1,203,606,928 | 1.4% | 4,944 |
| Missouri | 0.8% | 3,456,868,310 | 0.9% | 7,866 |
| Montana | 0.4% | 299,444,738 | 0.5% | 775 |
| Nebraska | 0.6% | 1,082,000,295 | 0.8% | 2,292 |
| Nevada | 0.3% | 793,587,031 | 0.6% | 2,405 |
| New Hampshire | 0.2% | 243,241,736 | 0.3% | 518 |
| New Jersey | 0.1% | 550,169,299 | 0.1% | 1,238 |
| New Mexico | 0.1% | 87,664,202 | 0.1% | 343 |
| New York | 0.1% | 1,155,189,257 | 0.1% | 2,864 |
| North Carolina | 0.6% | 4,548,081,427 | 0.9% | 13,489 |
| North Dakota | 0.6% | 434,974,144 | 0.8% | 980 |
| Ohio | 0.1% | 633,451,407 | 0.1% | 1,655 |
| Oklahoma | 0.8% | 1,894,366,930 | 1.2% | 6,552 |
| Oregon | 0.1% | 249,970,810 | 0.1% | 616 |
| Pennsylvania | 0.6% | 5,374,427,138 | 0.8% | 13,138 |
| Rhode Island | 0.5% | 357,743,861 | 0.4% | 709 |
| South Carolina | 0.8% | 2,571,738,703 | 1.2% | 8,068 |
| South Dakota | 0.7% | 507,126,054 | 0.8% | 1,059 |
| Tennessee | 0.8% | 3,928,266,687 | 1.2% | 11,460 |
| Texas | 0.7% | 16,228,390,220 | 1.2% | 51,213 |
| Utah | 0.6% | 1,631,272,994 | 1.0% | 5,176 |
| Vermont | 0.1% | 39,298,504 | 0.1% | 73 |
| Virginia | 0.4% | 2,489,798,718 | 0.5% | 6,497 |
| Washington | 0.2% | 1,405,561,173 | 0.3% | 3,525 |
| West Virginia | 0.8% | 787,408,790 | 1.2% | 2,516 |
| Wisconsin | 0.6% | 2,427,687,690 | 0.7% | 5,580 |
| Wyoming | 0.2% | 113,513,880 | 0.5% | 421 |
| Total | 0.4% | 100,813,949,570 | 0.6% | 285,819 |
Methodology
Results reported in this analysis correspond to the latest estimation of IWPR’s Cost of Reproductive Health Restrictions model. As in our previous analyses, this research seeks to answer the following question: What are the costs of abortion restrictions at the state level?
This model uses population-level macro analyses, pooling three years (January 2021 to December 2023) of US Bureau of Labor Statistics (BLS) data from the monthly Current Population Survey (CPS). All values reported are adjusted for inflation using 2022 constant prices.
The number of state-level abortion restrictions, our key independent variable, is constructed based on the Guttmacher Institute’s “Overview of Abortion Laws” (December 2023). For this ordinal measure, the abortion restrictions tracked by the Guttmacher Institute were weighed equally and combined into the following IWPR broader categories:
| IWPR Broad Categories | Guttmacher Narrow Categories |
|---|---|
| 1. TRAP laws | a. Must be performed by a licensed physician b. Must be performed in a hospital (if at gestational age) c. Second physician must participate (if at gestational age) |
| 2. Bans of procedures (bans on fetal age or methods) | a. Prohibited except in cases of life or health endangerment (if at gestational age) b. “Partial birth” abortion banned |
| 3. Public funding restricted (funds limited to life endangerment, rape, and incest) | a. Prohibits funding all or most medically necessary abortions b. Funds limited to life endangerment, rape, and incest |
| 4. Private funding restricted | a. Private insurance coverage limited |
| 5. Provider can refuse to participate | a. Individual b. Institution |
| 6. Mandated counseling includes information on: | a. Breast cancer link b. Fetal pain c. Negative psychological effects |
| 7. Waiting period (18 or more hours after counseling) | a. Any waiting period above zero |
| 8. Parental consent required for minors | a. Parental consent for minors |
| 9. Medication restriction | a. Must be provided by physician b. Patient must have in-person visit for prescription c. Gestational age limit for provision d. Patient must take first dose in presence of physician e. Mailing of abortion pills banned |
| 10. Total bans | |
| 11. Protections |
All 50 states and the District of Columbia were then assigned into abortion restrictions categories ranging from one to nine based on the number of abortion restrictions enacted in that state. To account for the economic impacts on women's labor force participation and earnings, we assigned the highest possible value of 10 to states that have bans or states listed as “most restrictive” by the Guttmacher Institute. A total of 16 states currently have bans. We also wanted to account for the impact of strong state-level protections on abortion rights, in which case states listed as “most protective” by the Guttmacher Institute were assigned the minimum possible value of one to account for their unrestricted access to reproductive health. Currently, eight states have enacted protections.
We follow our previous methodology to estimate the impact of state-level restrictions on women’s labor force participation between the ages of 15 and 44 and to evaluate the impact of state abortion restrictions on women’s earnings in this same age group and who were employed in the private sector.