![]()
Political Participation
Shaping their own future
When women participate in the political process, they shape policies in ways that reflect their interests and needs. The Status of Women in the States’ Political Participation Index looks at women as voters, grassroots activists and campaign fundraisers, and officeholders and examines the uneven progress they have made.
Articles and Publications

Resilient and Reaching for More: Challenges and Benefits of Higher Education for Welfare Participants and Their Children
This report details the inspiration, struggles, and perseverance of those pursuing a college degree while receiving welfare in California and the benefits that education brings them and their children.
Report to the Maryland Equal Pay Commission
The Institute for Women’s Policy Research constructed a dataset from the 2002 through 2004 American Community Survey Public Use Microdata Files (ACS) for people residing in the state of Maryland.

In Our Own Backyards: Local and State Strategies to Improve the Quality of Family Child Care
Th is report examines state and local policies and programs designed to improve the quality of family child care. For the purposes of this report, family child care is defined as a provider caring for two or more unrelated children in the provider’s home.

Status of Women in the States: 2004
Women in the United States have achieved significant advances and are seeing important changes in their lives. Their access to political, economic, and social rights has improved greatly over the past 40 years. Nonetheless, they do not enjoy equality with men, and they lack [...]

The Price of School Readiness: A Tool for Estimating the Cost of Universal Preschool in the States
DOWNLOAD REPORT Families and communities throughout the United States are embracing early childhood education as an important and beneficial experience for children. Policymakers are beginning to view children’s access to early education as a public good, and are debating ideas such as universal [...]
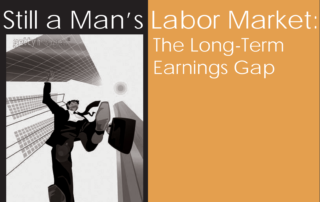
Still a Man’s Labor Market: The Long-Term Earnings Gap
Although the wage gap, measured by conventional methods, has narrowed in the last several decades, with women who work full-time full-year now earning 77 percent of what men earn (compared with 59 cents on the male dollar 40 years ago), its sweeping effects are largely unacknowledged because its measurement is limited to a single year and restricted to only a portion of the workforce. When accumulated over many years for all men and women workers, the losses to women and their families due to the wage gap are large and can be devastating.