Every Number Tells a Story. Choose Yours.
Our giving levels reflect real data from IWPR’s research—because evidence shapes not just our work, but how we invite you to support it.


IWPR’s Equal Pay Day blog series–including those analyzing data on Black women, AAPI women, Native women, Latina women, and Moms–highlights persistent gender wage gaps and unique challenges faced by marginalized communities in the labor market. Women’s experiences are not a monolith – this is especially true for Black women, who due to the history of institutional racism and misogyny in the United States, bear the unique brunt of experiencing both gender and racial discrimination simultaneously. The historical repercussions of these systems permeate numerous facets of our country today, particularly within employment.
Black Women’s Equal Pay Day is on September 21st this year, marking the 21.5 months that Black women need to work to make what the average* White, non-Hispanic man made in a 12 month period. Nationally in 2021, according to Census data released last week, on average*, Black women made just 64 cents for every dollar a White, non-Hispanic man earned. This gap narrows slightly when considering full-time year-round (FTYR) workers instead of all workers: Black women working FTYR earned 67 cents for every dollar a white man earns. This staggering pay inequity leads to differences in wealth that persist across generations.
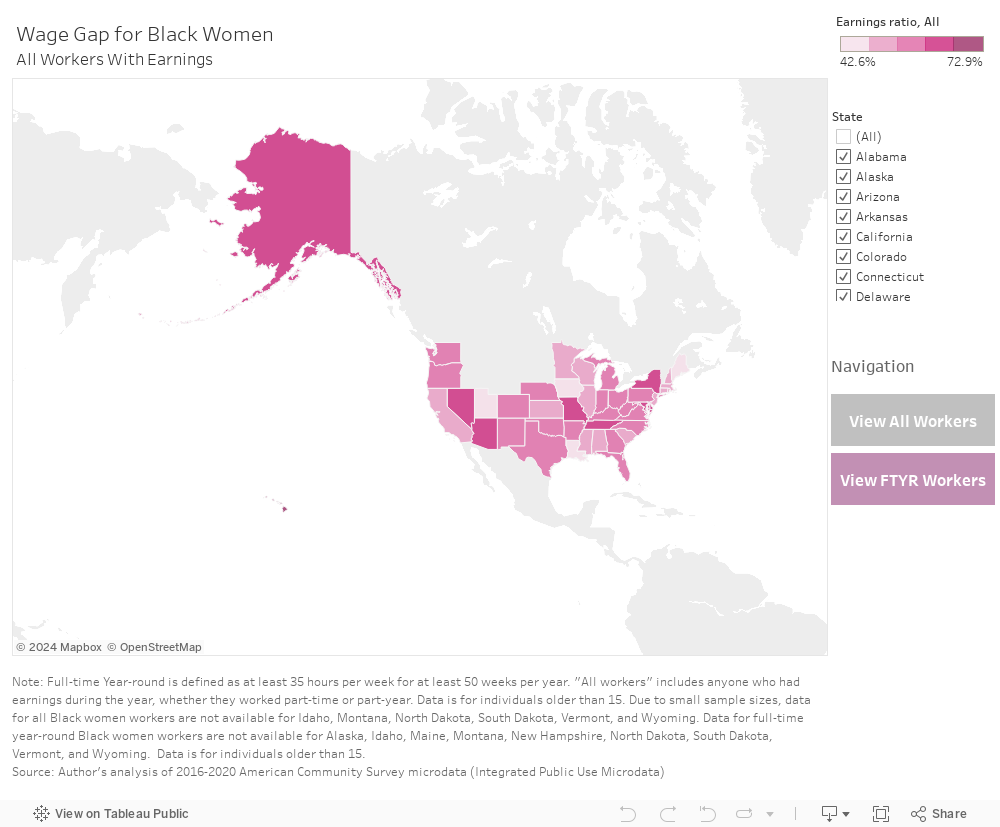
The inequality in earnings for Black women is found in every state. In more than three-quarters of U.S. states with sufficient data (34 out of 45 states), pay gaps are larger than the national average cited above. In fact, in those 34 states, Black women earned 60.0 percent or less than White, non-Hispanic men.To analyze differences in pay gaps for Black women across the U.S., IWPR used data from the 5-year American Community Survey (2016 – 2020) to create an interactive state-by-state map.
The interactive maps below show the average median earnings of Black women compared to White, non-Hispanic men along with the gender earnings ratio for each state with sufficient data.** Use the navigation buttons to view the map for full-time year-round workers and all workers.
The states with the largest wage gaps for Black women compared to White, non-Hispanic men were:
The states where Black women earned the least, on average*, were:
The states with the smallest wage gaps for Black women compared to White, non-Hispanic men, were:
Even in states where Black women had the highest annual earnings, gaps in pay are still significant:
These data are for all workers; to view data for FTYR workers, please use the navigation button labeled “View FTYR Workers”.
There are many reasons why significant pay disparities persist for Black women, including discrimination based on their race and gender. Among them are systemic discrimination in recruitment, hiring, and promotion, underrepresentation in professional and managerial jobs, and occupational segregation, leading to Black women being overrepresented in low-paid occupations and underrepresented in the jobs that pay the most. Over four in 10 Black women (42 percent) make $15 per hour or less, compared to just 13 percent of white men.
The earnings gap is particularly severe for mothers, with Black mothers only earning 46 cents for every dollar a White, non-Hispanic father earned nationally. Lower earnings for Black mothers has multiple causes, including the systemic racism and barriers described above, as well as those specific to mothers – the lack of access to work-family supports such as paid sick time, paid family leave, schedule control, and affordable, high-quality child care. Black mothers are also more likely to be the primary provider for their families: four in five Black mothers are the sole breadwinner of their families. This means that the inequality in pay does not only affect individual women, but entire families – impacting their ability to accumulate wealth and contributing to the racial wealth gap.
Policymakers must work to close the pay gap for Black women. Policy interventions must be multifaceted and intersectional, and include:
*Average here means the median, or midpoint, of the earnings distribution.
**Due to small sample sizes, data for all Black women workers are not available for Idaho, Montana, North Dakota, South Dakota, Vermont, and Wyoming. Data for full-time year-round Black women workers are not available for Alaska, Idaho, Maine, Montana, New Hampshire, North Dakota, South Dakota, Vermont, and Wyoming.
Thank you to Kate Ryan, Nina Besser Doorley, and Salma Elakbawy for providing policy analysis on this project.
Our giving levels reflect real data from IWPR’s research—because evidence shapes not just our work, but how we invite you to support it.